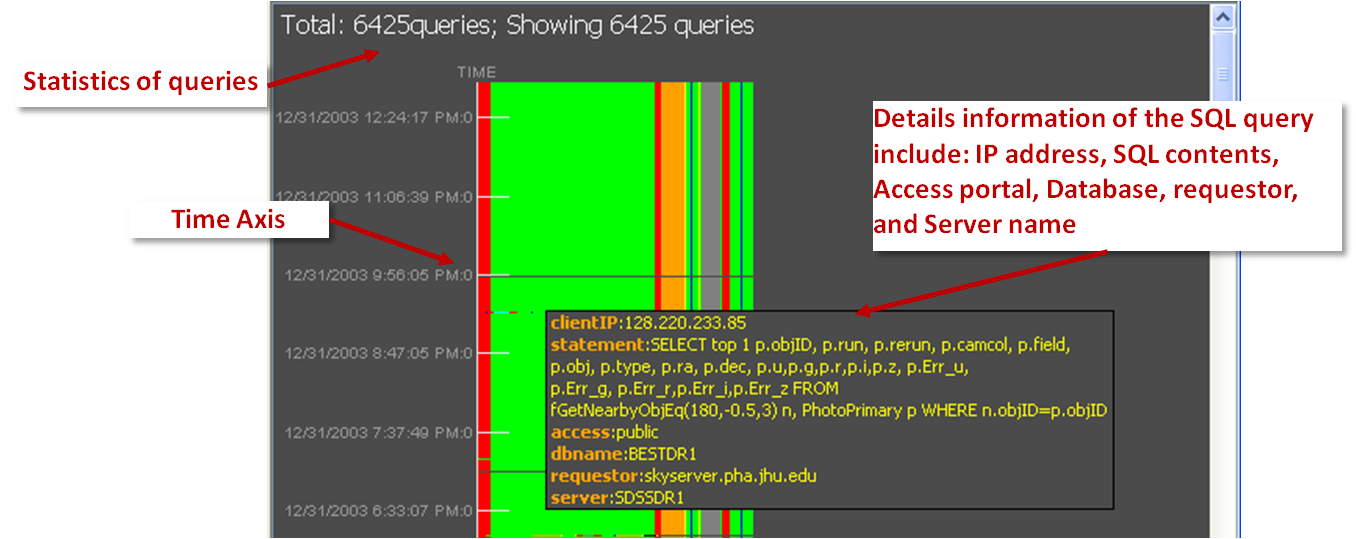
Interact With SQL Content View
A SQL Content View visualize maximum 50,000 lines of SQL queries that were sent to the SDSS data archive by users. Each line represent one SQL query.
Visual Abstraction
Instead of show its original text content of a query, this tool use a line of color-code bars as a visual representation. The below image shows how an SQL query is mapped into a visual representation.

Each SQL query is tokenized into terms and symbols, and they belong to nine categories, which are shown in the below image.

Also when mouse hover on empty area will show the category tip.
Interaction features
Users can interact with the SQL view in two ways:
- Hover on a line shows the major contents of an SQL query, e.g. IP address of the user, the text contents of a query, and etc..
- Hover on empty area in this view will show the category tip above.

A video demo of the initial user interface can be found at Demo page.
