Case Study
This page gives some results of the case study of using SDSS Log Viewer to understand users of SDSS data in terms of their data seeking behavior. Information about Who are the users, How did they access SDSS data, Why, When, and Where, came out. A few interesting cases are shown in the below section.
The results are not published yet. Therefore if you are interested in the detailed results, please contact me directly.
Interesting cases

Case 1: Scan
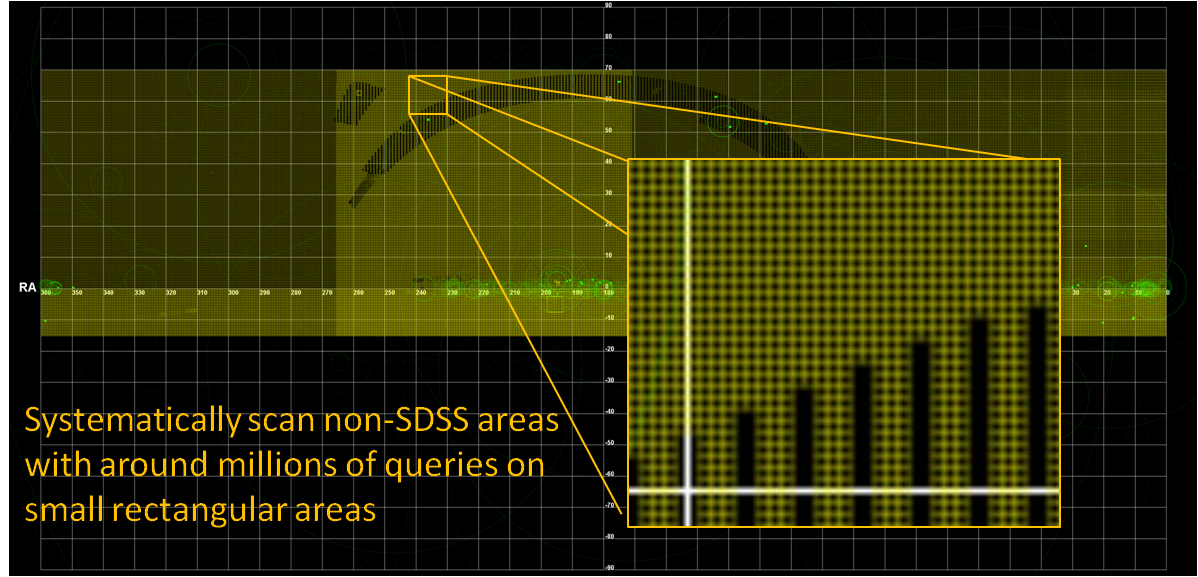
On the right shows a Scan type of user (NASA at Huntvill), who systematically scan the northern sky with around millions of queries on the NON-SDSS region. The enlarged image shows the small rectangular area that each query specified and the blank region which the user was intended to avoid.

Case 2: Search
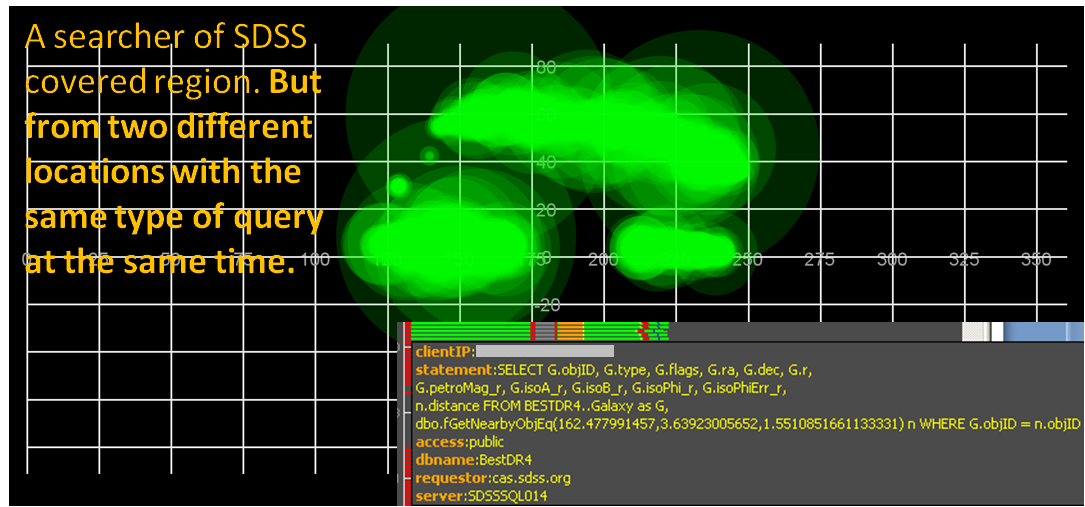
On the right shows a Search type of user, who searched the SDSS covered sky region with one same types of query at the same time, but from two different locations, one from a university at Boston area, and another from Burlington, Vermont, ~100 miles away..

Case 3: Retrieve
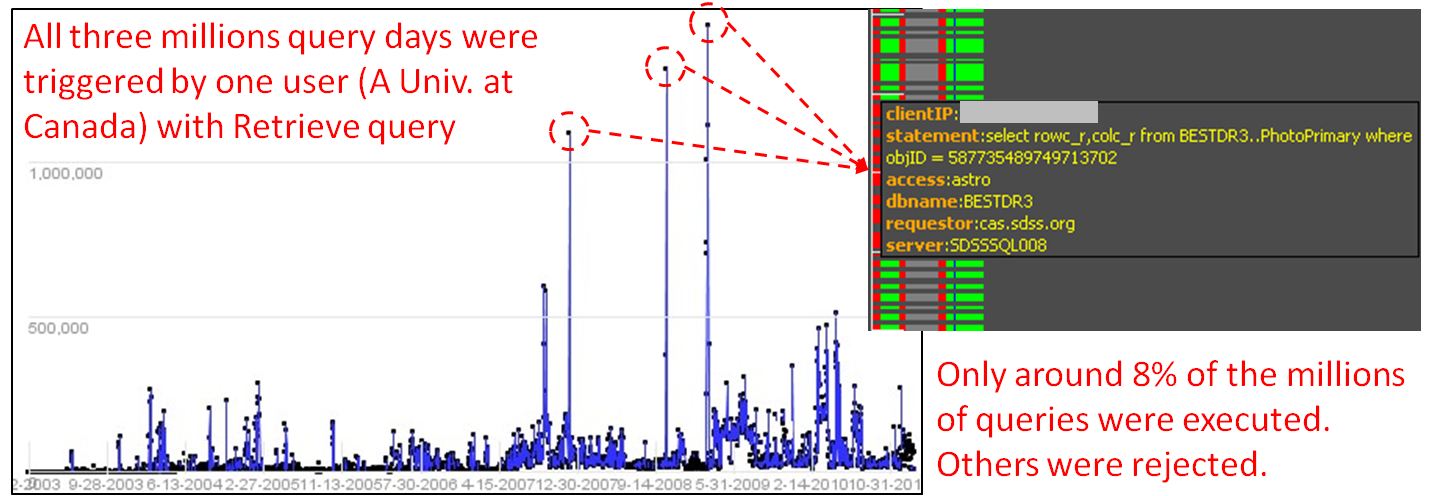
On the right shows a Retriever (A university at Canada), who sent a simple query with different ObjID to retrieve SDSS data. This user caused all the three millions query days. But only 8% of the millions of queries were executed by the SDSS database. All others were rejected because it violated SDSS query policy that only one query per second is allowed.
More is coming...
