SDSS Log Viewer
The SDSS Log Viewer project aims to design an information visualization tool for Sloan Digital Sky Survey managers and information scientists to quick explore the SDSS SkyServer SQL query log data. Because the log data is very large, ~million rows per month, visualization is an ideal method for quick exploration of the large information space in SDSS SQL log data. Through visual exploration, managers, analysts, and scientist could reveal patterns and models, which would help them to understand users' data search and data retrieval behaviors, and further, if combined with domain experts background knowledge about SDSS project and the data archive, to infer users' data access intents. By integrated with information seeking and behavior theories, these patterns and models could form hypotheses, allowing further testing with visual and non-visual method.
This project is the second half of my Ph.D dissertation study, which endeavors to reveal how SDSS data users search and retrieval SDSS data from the SkyServer data archive, and what are the common search and retrieval patterns. In addition, I would like to use information seeking and information behavior theories to model the SDSS data users.
Furthermore, insights and models coming from this project could help current and future scientific data archive designers and managers to understand their potential users better and tune their design to better serve their users. For policy makers, some statistics from this project somehow would help them to know the impact of funding that they investigate to science.
Brief of GUI of the tool
The SDSS Log Viewer contains two panels: a Timeline Panel and a SQL Content Panel. The Timeline Panel contains a Timeline View visualization. The SQL Content Panel contains three views.

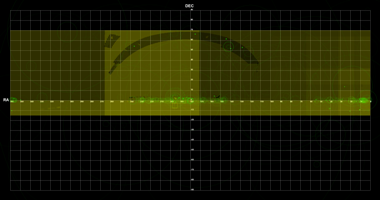
Timeline view showS frequency distribution of queries in the time unit of a day, a month, and a year from Jan. 2003 to now.
Users can drag both vertical and horizontal sliders to adjust the range of values for scrutinity.

The SQL Content Panel includes a SQL Content View, a SkyMap View, and a Statistics View.
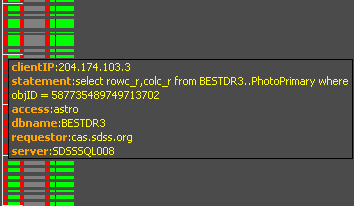
SQL Content View (left panel), showing the contents of SQL statement of queries. A SQL statement is tokenized into words and symbols. Each word and symbol is assigned into one type in a 10 types category. And each type of token is assigned a unique color. Therefore a SQL statement become one composite line with different color bars. The length of each bar is corresponding to the token's length in the statement.
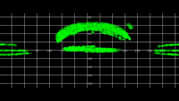
SkyMap View (top right panel), showing sky areas that were specified in users' queries. There two kinds of areas: Circles in green and Rectangles in yellow.
Statistics View (bottom right panel) is a tree map visualization, showing the distributions of categorical attributes in the SDSS logs, such as the IP addresses, Database names, and etc.
The SDSS Log Viewer has Dynamic Query menu, which will help users to choose which queries are shown in the SkyMap View and SQL Content View.
System requirements for running the tool
Java JRE: version 6.0 or above
Memory: 1GB minimum, 2G ideal
Internet: Must have an Internet connection, which allows remote
database access
Announcements
2011.3.8: New version 1.0 is issued, adding a sample function, which
allow users to input a SQL and view how this SQL will be visualized in the
SQL Content View.
2011.2.16: A web start is created to facilitate deployment.
2011.2.13: Alpha version 0.3 is issued, adding save image function
in the GUI if users right click on the image in each view.
2011.1.22: Alpha version 0.1 is issued, fixing a few bugs.
2011.1.19: After three month coding, the first functional
SDSS Log Viewer is online!
In memory of two Jims
Jim Gray (1944-2007): a pioneer of the Data-Intensive Science
Jim Thomas (1946-2010): a pioneer of the Visual Analytics
This project is inspired by their great ideas