Use Dynamic Query Menu
The SDSS Log View has a dynamic query menu located on the bottom of the UI. By set filter parameters in this menu, users can control which queries are visualized in the SQL Content View and SkyMap View. When the menu button enabled, click it will show the pop-up menu.

Below list detailed explanation of each component of the menu.
Range Slider Query
On the left side of dynamic query menu are two range sliders, including:
- Query run time: show the range of queries' running time.
- Number of rows: show the number of rows returned to queries.

Users can adjust the range slider or input the minimum and maximum values of the range.
Select Query
On the middle and right side of dynamic query menu are five multiple select menu queries, including:
- IP Address: show IP addresses of queries.
- Requestor: show requestors of queries.
- Server: show servers that users queried.
- Database: show databases that users queried.
- Access portal: show access portals that queries were from.
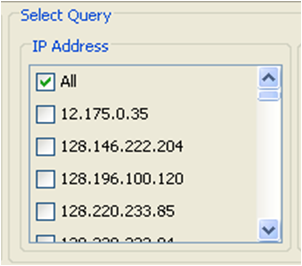
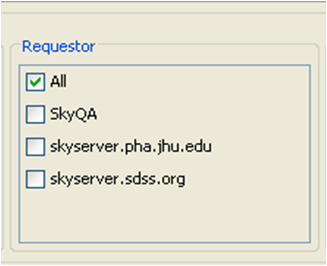
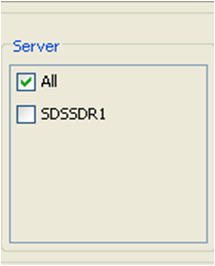
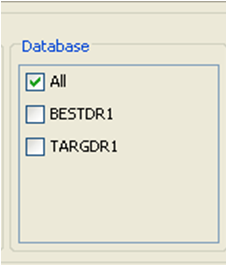
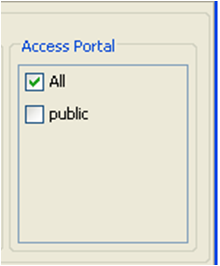
Users can select "All" option, which will include all option on a select query component. Deselect "All" option, and select one or more other options will show queries with the selected features in SQL Content View and SkyMap View.
A video demo of the initial user interface can be found at Demo page.
