Interact With SkyMap View
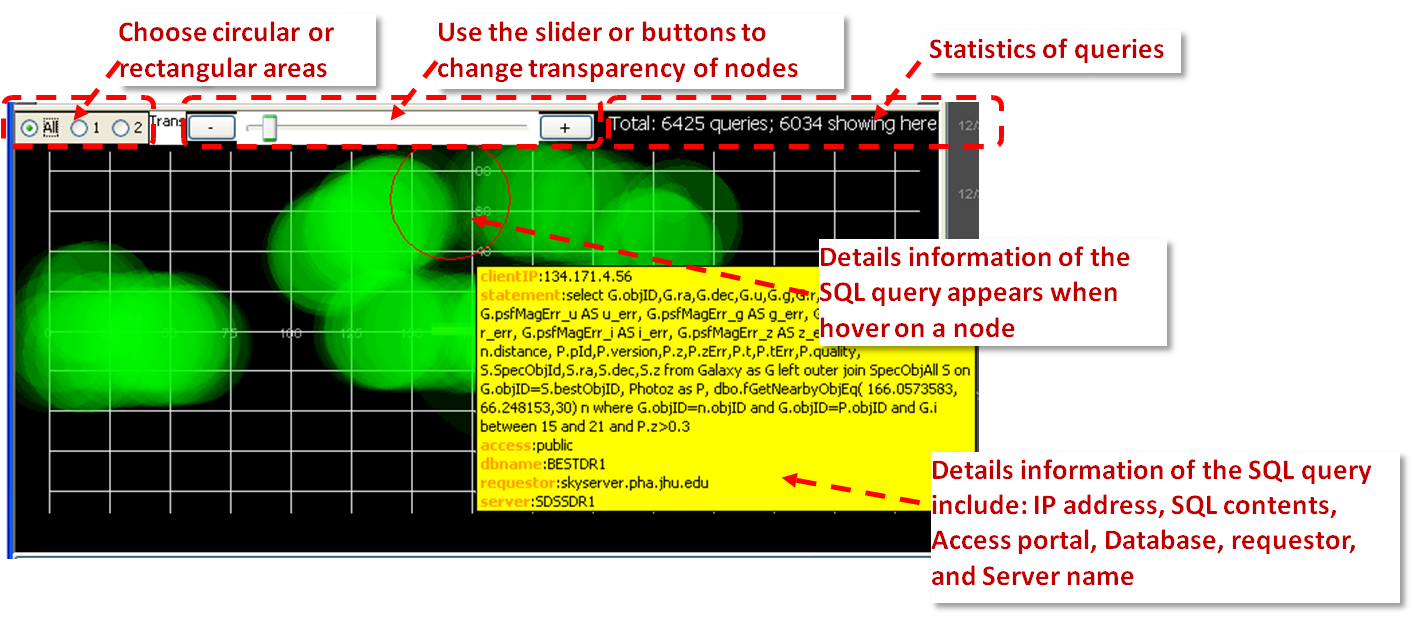
Some queries include spatial information, such as Right Ascension and Declination, and Shapes (Circle or Rectangular). This tool extract this information out and visualize in the SkyMap View on a 2-D Universe map in the coordinate of RA and DEC.
Visual Abstraction
In the SDSS SQL log data, there two kinds of spatial information
- Circular area: specified by a center point shown in RA and DEC, and its radius.
- Rectangular area: specified by two set of RA and DEC, one for the top-left corner, and another for the bottom-right corner.
For areas that overlap, this tool use transparency as an indicator of overlapping . Therefore, the brighter a region, the more overlapped search in that region.
Interaction features
Users can interact with the SQL view in two ways:
- Choose to show circular or rectangular areas only, or both.
- Adjust transparency level of overlapping.
- Zoom in and out via wheel forward and backward.
- Hover on an area in this view will show detailed information of a query.

A video demo of the initial user interface can be found at Demo page.
